In 2025, most American households are still
priced out of median-priced homes. Nearly
75% of U.S. households cannot afford a median-priced new home when applying traditional underwriting rules (PITI ≤ 28% of income), with median prices near $460,000 and rates elevated. That makes identifying
truly affordable housing markets crucial for first-time buyers who want to translate income into a realistic mortgage payment. Here’s how to analyze and compare markets using real numbers, affordability ratios, and actionable strategies.
1) Why affordability varies so much across markets
Housing affordability is fundamentally about
home price relative to income. The National Association of Realtors’ affordability index has been weak (below the threshold where median earners can afford median homes), meaning
most cities are still unaffordable.
Key affordability drivers:- Median home prices
- Local incomes
- Property taxes & insurance
- Mortgage rates (still high in 2025)
Actionable tip: Always calculate the
price-to-income ratio: [\text{Price-to-Income} = \frac{\text{Median Home Price}}{\text{Median Household Income}}] A value near
3.0 or below is traditionally considered affordable; above that often signals stress.
2) Top metros where first-time buyers have the best odds
Multiple 2025 market rankings highlight metros with strong affordability for first-time buyers, based on
price relative to income and availability.
Notable affordable metros:- Harrisburg, PA – Median prices much lower than national average with solid employment
- Rochester, NY – A low home price base around ~$130k makes payments small
- Lansing, MI – Strong ratio of income to price
- North Little Rock, AR – Good prices relative to income
- Villas / Cape Coral, FL – Lower median prices with growth potential
In these markets,
median mortgage payments can come in under $1,000–$1,500/month before taxes/insurance, depending on down payment and your rate assumptions.
Actionable tip: Don’t assume “cheap” means “good deal.” Always calculate expected monthly PITI using a
Mortgage Payment Calculator with your planned down payment and rate scenario.
3) Large city affordability: rare but possible
For the
50 largest U.S. metros, affordability remains weak: often requiring
>40–45% of income on housing before taxes/insurance—even when rates moderate. However, a few large metros still offer relative affordability due to lower prices or stronger incomes:
- Some Midwest and Rust Belt metros
- Secondary cities with balanced price/income ratios
Example calculation (illustrative):- Metro median home price: $230,000
- Income (median): $60,000
- Loan assumptions: 6.2% on a 30-year fixed
- Approx PI payment: $1,400
- Taxes & insurance (approx): $450
- Total PITI: $1,850
[\text{DTI housing ratio} = \frac{1,850}{5,000} = 37%] This is still
tight but often within stretch limits for many first-time buyers.
Actionable tip: If total housing ratio is above
35–38%, negotiate price down or increase down payment to reduce risk of DTI rejection.
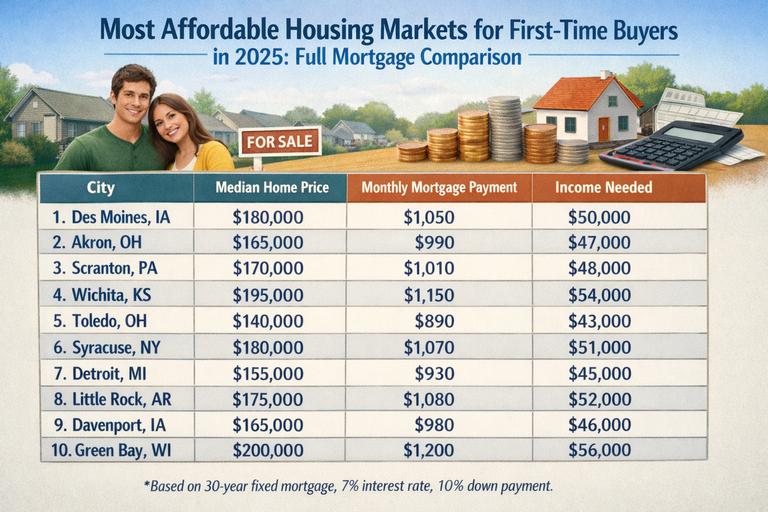
4) Smaller markets & secondary cities: strongest numbers
Studies like the “Most Affordable Places To Buy A Home in 2025” list dozens of smaller cities — many in the Midwest and South — where average prices are
significantly below the national median.
Examples from affordability rankings:- Cincinnati, OH – single-family value often ~$230k–$240k
- El Paso, TX – values ~$220k–$230k
- Des Moines, IA – home values ~$200k range
- Tulsa, OK – consistent affordability for median incomes
Lower prices plus realistic incomes often deliver monthly payments under
$1,800 for modest homes — and sometimes under
$1,500 in the smallest cities.
Actionable tip: Use the
Home Affordability Calculator with local median incomes and prices to see where your dollars buy the most house.
5) Regional trends affecting affordability
Some regional patterns matter in 2025:
- Midwest & Rust Belt: Overall lower prices relative to incomes
- South & Southeast: Lower price bases but sometimes higher taxes/insurance
- Sun Belt: Mixed — lower taxes but growing demand pushing prices
- High-cost coastal metros: Least affordable — often impossible without high income or large down payment
These regional patterns show up in multiple affordability indices and market reports.
Actionable tip: Don’t ignore
tax/insurance costs even in lower-price areas — they can add
$200–$600/month to carrying cost.
6) Mortgage rate impact on affordability
Even in affordable markets,
mortgage rates dramatically shift monthly payments.
Example (illustrative): Using a 30-year fixed:
- 5.5% ➜ Lower payment
- 6.5–7.0% ➜ Roughly 10–15% higher monthly payment This can make a big difference when budgeting in tight markets.
Actionable tip: Calculate break-even scenarios at:
- current average rate
- +0.5% (worse case)
- –0.5% (best case)
This gives a realistic range of payment expectations before you make an offer.
7) A practical step-by-step market comparison
Here’s how to choose:
- Gather data: median price, median income, local property tax rate
- Run affordability math: use price, down payment, and a realistic rate
- Calculate DTI using your income (include other debts)
- Stress-test taxes & insurance (assume +10–20% increases)
- Add closing & moving costs into your upfront budget
This disciplined math is what separates
hope from
decision-ready offers.
Conclusion
Even as the U.S. housing market remains challenging in 2025—with national median prices high and many households priced out—there are
real markets where first-time buyers can still find affordable homes. By focusing on cities with lower price-to-income ratios and realistic monthly payments, you increase your odds of not just buying—but affording—your first home. Deep local data and national indices show that
secondary metros and smaller cities offer the most tangible affordability, while major coastal cities demand higher incomes or creative strategies.
FAQs
1) What makes a market “affordable” in 2025? Affordability is driven by low home prices relative to local median income, reasonable taxes/insurance, and manageable monthly payments after applying today’s mortgage rates.
2) Are there affordable large metro areas? A few Midwest and secondary metros remain relatively affordable, but most of the largest U.S. cities require a high income to afford median homes.
3) How do I compare cities using data? Use price-to-income ratios, median price data, and your own monthly budget to calculate expected payments and debt ratios. Tools like affordability calculators help.
4) Do mortgage rates matter for affordability? Greatly. Higher rates increase monthly payments and tighten what price you can realistically afford for any given income.
5) Should I relocate to an affordable city? Relocation can improve affordability but consider job prospects, taxes, insurance costs, and long-term plans before choosing a market.