Understanding historical mortgage rates from 1971 to 2025 offers valuable perspective for homebuyers, homeowners, and investors. Mortgage rates have fluctuated dramatically over the past five decades, influenced by inflation, economic cycles, and central bank policy. By examining the history of mortgage rates, you can better appreciate today’s rates and anticipate future trends.
30-Year Fixed Mortgage Rates: A Timeline
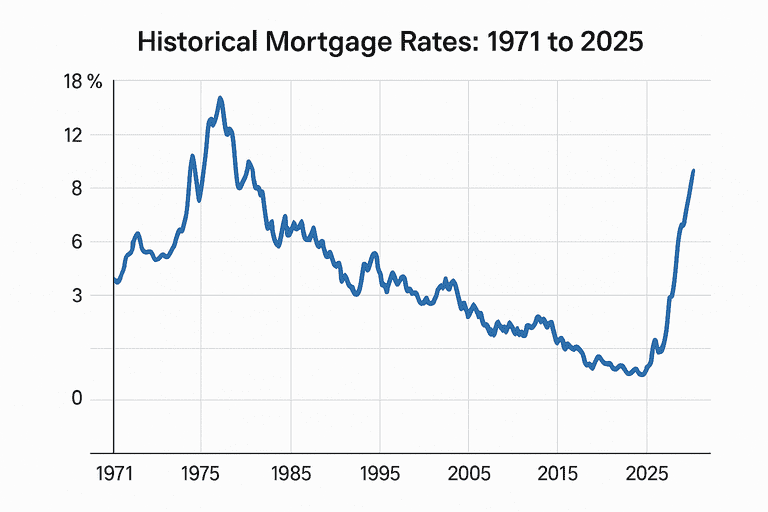
The 30-year fixed-rate mortgage is the most popular home loan in the United States. Freddie Mac began tracking weekly rates in April 1971, providing a detailed record of how rates have changed over time.
Key Historical Mortgage Rate Milestones
Highest annual average: 16.64% in 1981
Lowest annual average: 2.96% in 2021
Long-term average (1971–2025): 7.71%
Mortgage Rates by Decade
1970s: Rising Inflation and the Start of Volatility
Range: 7.38% (1972) to 11.20% (1979)
Trend: Rates increased due to high inflation, oil crises, and aggressive Federal Reserve actions to curb price growth.
Impact: Homeownership became more expensive, and affordability declined.
1980s: Record Highs and Economic Turbulence
Range: 10.19% (1986) to 16.64% (1981)
Peak: 1981 saw the highest average mortgage rate ever, a result of the Fed’s fight against runaway inflation.
Trend: Rates remained in double digits for most of the decade, gradually declining as inflation was tamed.
Impact: High rates made buying and refinancing homes challenging, suppressing demand and home prices.
1990s: Economic Prosperity and Declining Rates
Range: 6.94% (1998) to 10.13% (1990)
Trend: The U.S. economy boomed, the internet revolution spurred growth, and rates slowly declined, improving affordability.
Impact: Lower rates encouraged home buying and refinancing, fueling a strong real estate market.
2000s: Boom, Bust, and Recovery
Range: 5.04% (2009) to 8.05% (2000)
Trend: Rates dropped from 8% to below 6% by 2003, fueling a housing boom. The 2008 financial crisis led to a crash, and the Fed slashed rates to stimulate the economy.
Impact: Lower rates helped stabilize the market post-crisis, but home values and equity suffered.
2010s: Historic Lows and Market Stability
Range: 3.65% (2016) to 4.69% (2010)
Trend: Fed policies kept rates low to support recovery from the Great Recession. Rates hovered between 3.5% and 4.5% for most of the decade.
Impact: Low rates made homeownership more affordable, spurring demand and price growth.
2020s: Pandemic Lows and Post-Pandemic Highs
Range: 2.96% (2021) to 6.89% (2025 as of June)
Trend: The COVID-19 pandemic led to emergency rate cuts, pushing mortgage rates to record lows in 2021. As inflation returned, the Fed raised rates, and mortgage rates surged past 6% in 2023 and 2025.
Impact: Ultra-low rates in 2020–2021 sparked a home buying and refinancing boom. Higher rates since 2022 have slowed demand and cooled housing markets.
Year-by-Year Average 30-Year Fixed Mortgage Rates (Selected Years)
| Year | Avg. Rate | Year | Avg. Rate | Year | Avg. Rate |
|---|---|---|---|---|---|
| 1971 | 7.54% | 1990 | 10.13% | 2010 | 4.69% |
| 1975 | 9.05% | 1995 | 7.93% | 2015 | 3.85% |
| 1981 | 16.64% | 2000 | 8.05% | 2020 | 3.11% |
| 1986 | 10.19% | 2005 | 5.87% | 2021 | 2.96% |
| 1998 | 6.94% | 2009 | 5.04% | 2023 | 6.81% |
| 2003 | 5.83% | 2012 | 3.66% | 2025 | 6.81% |
Source: Freddie Mac Primary Mortgage Market Survey®
Historical Mortgage Rates in Canada (1975–2025)
Highest: 21.75% (August 1981, 5-year fixed)
Lowest: 2.79% (January 2021, 1-year fixed)
2020s Average: 5.55% (range: 4.79%–7.04%)
Canadian mortgage rates have followed similar trends, with extreme highs in the early 1980s and record lows in 2021. The 2020s have seen rates rise sharply due to inflation and central bank tightening.
How Mortgage Rates Influence Real Estate Markets
Mortgage rates are a key driver of housing affordability, demand, and home prices. Lower rates make borrowing cheaper, boosting demand and home prices. Higher rates increase monthly payments, reducing affordability and slowing the market. First-time buyers are especially sensitive to rate changes, as even small increases can significantly affect purchasing power.
Key Takeaways: Historical Mortgage Rates 1971 to 2025
Rates peaked at 16.64% in 1981 and hit a low of 2.96% in 2021.
The long-term average (1971–2025) is about 7.7%.
Mortgage rates are influenced by inflation, economic cycles, and central bank policy.
Today’s rates, while high compared to 2020–2021, are still below the extreme highs of the 1980s.
Understanding historical mortgage rates helps buyers and investors make informed decisions.
Conclusion
The history of mortgage rates from 1971 to 2025 reveals dramatic swings shaped by inflation, economic events, and policy changes. While current rates are higher than recent lows, they remain below historic peaks. Staying informed about mortgage rate trends is essential for navigating the real estate market and making sound financial decisions.